

Hi Sugar Club members,
Looking out for some help and guidance on a report in Sugar Discover.
Our customer wants a report on what was the state of specific opportunities during a date range
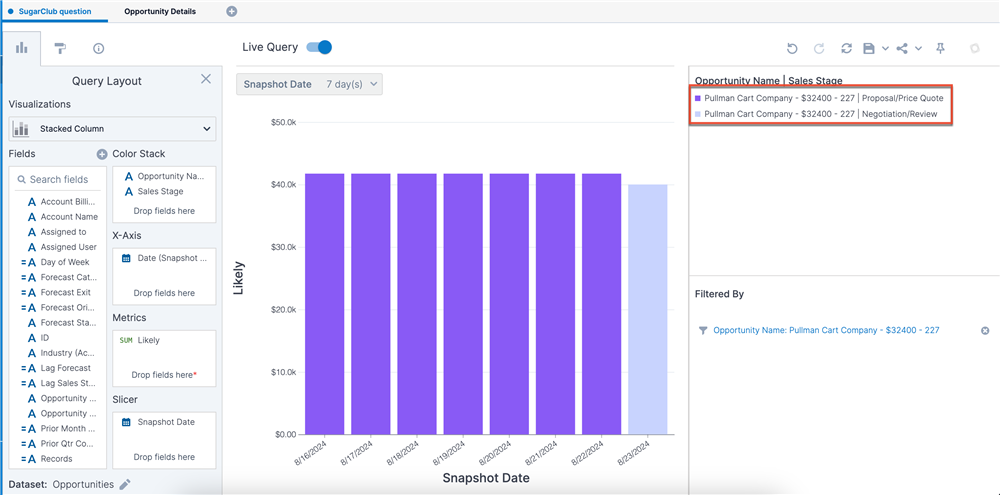
** A graph that has snapshot dates/month on the X axis and what was the ‘Likely’ amount and / or the Sales Stage for those records on that particular snapshot date.
Would anyone have any insights on what fields and metrics do we use to achieve something like this.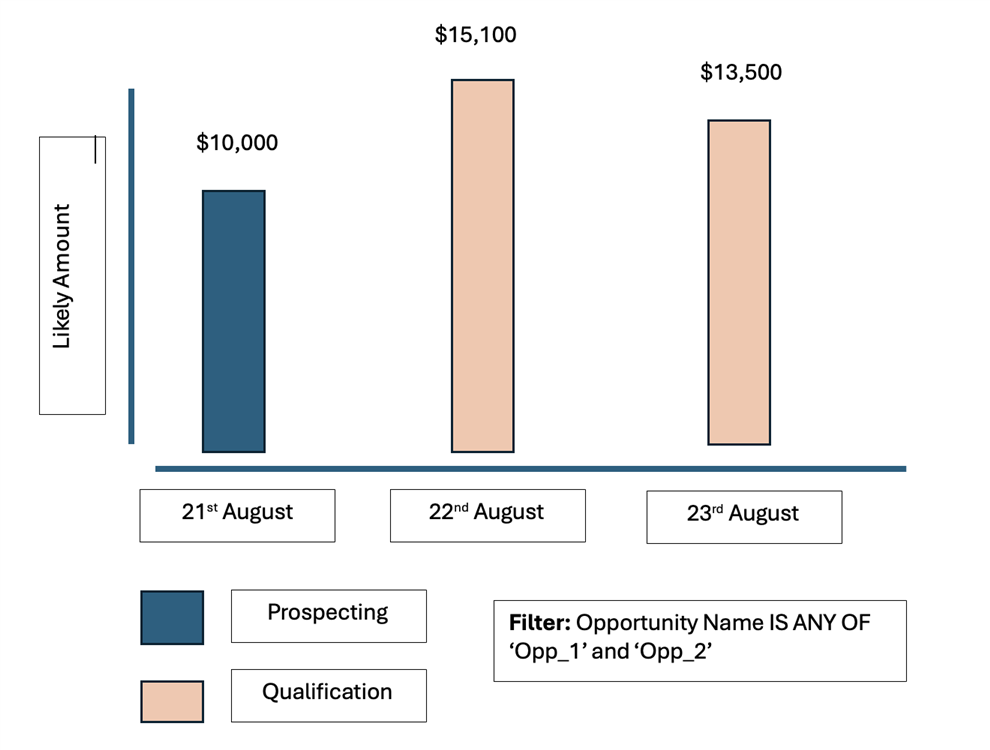
Regards,
Sheldon

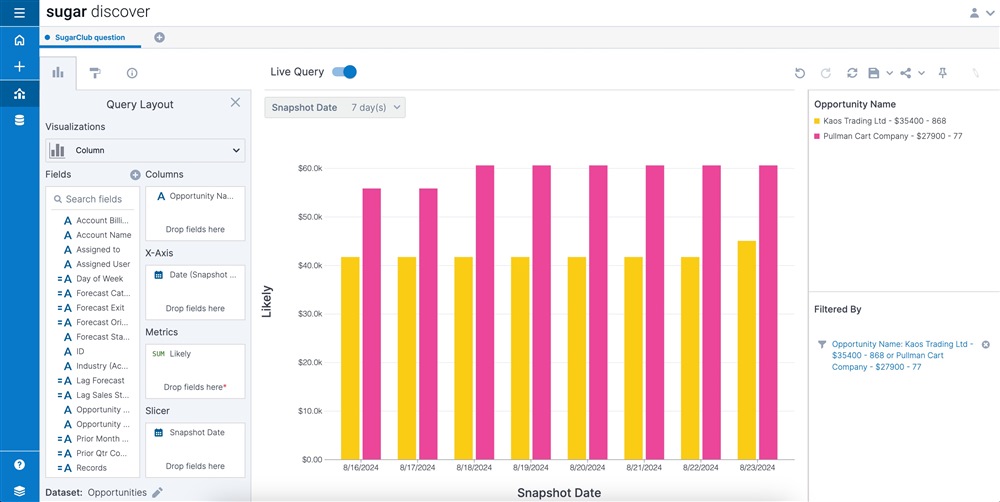
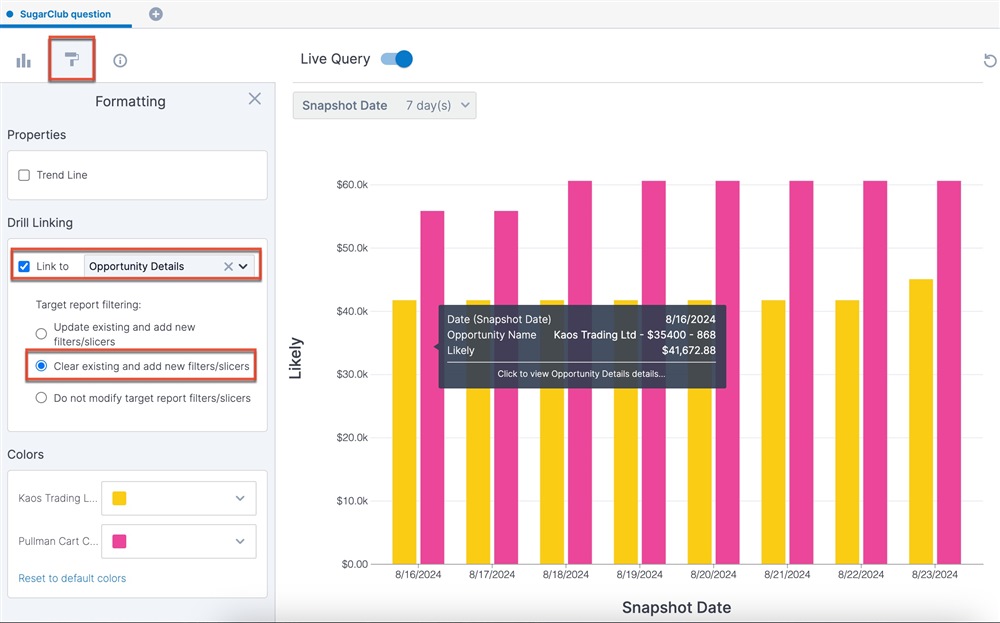
 I think this way is easier to use when looking at multiple opportunities so that you don't have as many colors. Because each opportunity and sales stage combo will have its own color, having several opportunities and sales stages will get hard to keep track of (at least for me!).